Examples
Comparison of correlation methods
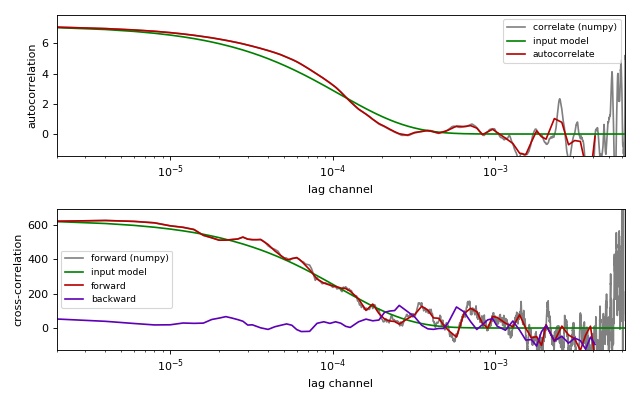
This example illustrates the differences between the
multipletau correlation methods
(multipletau.autocorrelate(),
multipletau.correlate()) and numpy.correlate().
This example requires noise_generator.py to be present in the
current working directory.
compare_correlation_methods.py
1 2 3 4 5 6 7 8 9 10 11 12 13 14 15 16 17 18 19 20 21 22 23 24 25 26 27 28 29 30 31 32 33 34 35 36 37 38 39 40 41 42 43 44 45 46 47 48 49 50 51 52 53 54 55 56 57 58 59 60 61 62 63 64 65 66 67 68 69 70 71 72 73 74 75 76 77 78 79 80 81 82 83 84 85 86 87 88 89 90 | from matplotlib import pylab as plt
import numpy as np
from multipletau import autocorrelate, correlate, correlate_numpy
from noise_generator import noise_exponential, noise_cross_exponential
# starting parameters
N = np.int(np.pi * 1e3)
countrate = 250. * 1e-3 # in Hz
taudiff = 55. # in us
deltat = 2e-6 # time discretization [s]
normalize = True
# time factor
taudiff *= deltat
# create noise for autocorrelation
data = noise_exponential(N, taudiff, deltat=deltat)
data -= np.average(data)
if normalize:
data += countrate
# perform autocorrelation (multipletau)
gac_mt = autocorrelate(data, deltat=deltat, normalize=normalize)
# numpy.correlate for comparison
gac_np = correlate_numpy(data, data, deltat=deltat,
normalize=normalize)
# calculate model curve for autocorrelation
x = gac_np[:, 0]
amp = np.correlate(data - np.average(data), data - np.average(data),
mode="valid")
if normalize:
amp /= len(data) * countrate**2
y = amp * np.exp(-x / taudiff)
# create noise for cross-correlation
a, v = noise_cross_exponential(N, taudiff, deltat=deltat)
a -= np.average(a)
v -= np.average(v)
if normalize:
a += countrate
v += countrate
gcc_forw_mt = correlate(a, v, deltat=deltat, normalize=normalize) # forward
gcc_back_mt = correlate(v, a, deltat=deltat, normalize=normalize) # backward
# numpy.correlate for comparison
gcc_forw_np = correlate_numpy(a, v, deltat=deltat, normalize=normalize)
# calculate the model curve for cross-correlation
xcc = gac_np[:, 0]
ampcc = np.correlate(a - np.average(a), v - np.average(v), mode="valid")
if normalize:
ampcc /= len(a) * countrate**2
ycc = ampcc * np.exp(-xcc / taudiff)
# plotting
fig = plt.figure(figsize=(8, 5))
fig.canvas.set_window_title('comparing multipletau')
# autocorrelation
ax1 = fig.add_subplot(211)
ax1.plot(gac_np[:, 0], gac_np[:, 1], "-",
color="gray", label="correlate (numpy)")
ax1.plot(x, y, "g-", label="input model")
ax1.plot(gac_mt[:, 0], gac_mt[:, 1], "-",
color="#B60000", label="autocorrelate")
ax1.legend(loc=0, fontsize='small')
ax1.set_xlabel("lag channel")
ax1.set_ylabel("autocorrelation")
ax1.set_xscale('log')
ax1.set_xlim(x.min(), x.max())
ax1.set_ylim(-y.max()*.2, y.max()*1.1)
# cross-correlation
ax2 = fig.add_subplot(212)
ax2.plot(gcc_forw_np[:, 0], gcc_forw_np[:, 1], "-",
color="gray", label="forward (numpy)")
ax2.plot(xcc, ycc, "g-", label="input model")
ax2.plot(gcc_forw_mt[:, 0], gcc_forw_mt[:, 1], "-",
color="#B60000", label="forward")
ax2.plot(gcc_back_mt[:, 0], gcc_back_mt[:, 1], "-",
color="#5D00B6", label="backward")
ax2.set_xlabel("lag channel")
ax2.set_ylabel("cross-correlation")
ax2.legend(loc=0, fontsize='small')
ax2.set_xscale('log')
ax2.set_xlim(x.min(), x.max())
ax2.set_ylim(-ycc.max()*.2, ycc.max()*1.1)
plt.tight_layout()
plt.show()
|