multipletau documentation
General
Multipletau provides a multiple-τ algorithm for Python 2.7 and
Python 3.x with numpy as its sole dependency.
Multipe-τ correlation is computed on a logarithmic scale (less
data points are computed) and is thus much faster than conventional
correlation on a linear scale such as numpy.correlate().
Recommended literature
- Klaus Schaetzel and Rainer Peters; Noise on multiple-tau photon correlation data. Proc. SPIE 1430, Photon Correlation Spectroscopy: Multicomponent Systems, 109 (June 1, 1991); http://doi.org/10.1117/12.44160
- Thorsten Wohland, Rudolf Rigler, and Horst Vogel; The Standard Deviation in Fluorescence Correlation Spectroscopy. Biophysical Journal, 80 (June 1, 2001); http://dx.doi.org/10.1016/S0006-3495(01)76264-9
Obtaining multipletau
If you have Python and numpy installed, simply run
pip install multipletau
The source code of multipletau is available at https://github.com/FCS-analysis/multipletau.
Citing multipletau
The multipletau package should be cited like this (replace “x.x.x” with the actual version of multipletau used and “DD Month YYYY” with a matching date).
cite
Paul Müller (2012) Python multiple-tau algorithm (Version x.x.x) [Computer program]. Available at https://pypi.python.org/pypi/multipletau/ (Accessed DD Month YYYY)
You can find out what version you are using by typing (in a Python console):
>>> import multipletau
>>> multipletau.__version__
'0.1.4'
Usage
The package is straightforward to use. Here is a quick example:
>>> import numpy as np
>>> import multipletau
>>> a = np.linspace(2,5,42)
>>> v = np.linspace(1,6,42)
>>> multipletau.correlate(a, v, m=2)
array([[   0.        ,  569.56097561],
       [   1.        ,  549.87804878],
       [   2.        ,  530.37477692],
       [   4.        ,  491.85812017],
       [   8.        ,  386.39500297]])
Methods
Summary:
autocorrelate(a[, m, deltat, normalize, …]) |
Autocorrelation of a 1-dimensional sequence on a log2-scale. |
correlate(a, v[, m, deltat, normalize, …]) |
Cross-correlation of two 1-dimensional sequences on a log2-scale. |
correlate_numpy(a, v[, deltat, normalize, …]) |
Convenience function that wraps around numpy.correlate() and returns the correlation in the same format as correlate() does. |
Autocorrelation
-
multipletau.autocorrelate(a, m=16, deltat=1, normalize=False, copy=True, dtype=None)[source]¶ Autocorrelation of a 1-dimensional sequence on a log2-scale.
This computes the correlation similar to
numpy.correlate()for positive \(k\) on a base 2 logarithmic scale.numpy.correlate(a, a, mode="full")[len(a)-1:]()\(z_k = \Sigma_n a_n a_{n+k}\)
Parameters: - a (array-like) – input sequence
- m (even integer) – defines the number of points on one level, must be an even integer
- deltat (float) – distance between bins
- normalize (bool) – normalize the result to the square of the average input signal and the factor \(M-k\).
- copy (bool) – copy input array, set to
Falseto save memory - dtype (object to be converted to a data type object) – The data type of the returned array and of the accumulator for the multiple-tau computation.
Returns: autocorrelation – the lag time (1st column) and the autocorrelation (2nd column).
Return type: ndarray of shape (N,2)
Notes
Changed in version 0.1.6: Compute the correlation for zero lag time.
The algorithm computes the correlation with the convention of the curve decaying to zero.
For experiments like e.g. fluorescence correlation spectroscopy, the signal can be normalized to \(M-k\) by invoking
normalize = True.For normalizing according to the behavior of
numpy.correlate(), usenormalize = False.For complex arrays, this method falls back to the method
correlate().Examples
>>> from multipletau import autocorrelate
>>> autocorrelate(range(42), m=2, dtype=np.float_)
array([[  0.00000000e+00,   2.38210000e+04],
       [  1.00000000e+00,   2.29600000e+04],
       [  2.00000000e+00,   2.21000000e+04],
       [  4.00000000e+00,   2.03775000e+04],
       [  8.00000000e+00,   1.50612000e+04]])
Cross-correlation
-
multipletau.correlate(a, v, m=16, deltat=1, normalize=False, copy=True, dtype=None)[source]¶ Cross-correlation of two 1-dimensional sequences on a log2-scale.
This computes the cross-correlation similar to
numpy.correlate()for positive \(k\) on a base 2 logarithmic scale.numpy.correlate(a, v, mode="full")[len(a)-1:]()\(z_k = \Sigma_n a_n v_{n+k}\)
Note that only the correlation in the positive direction is computed. To obtain the correlation for negative lag times swap the input variables
aandv.Parameters: - v (a,) – input sequences with equal length
- m (even integer) – defines the number of points on one level, must be an even integer
- deltat (float) – distance between bins
- normalize (bool) – normalize the result to the square of the average input signal and the factor \(M-k\).
- copy (bool) – copy input array, set to
Falseto save memory - dtype (object to be converted to a data type object) – The data type of the returned array and of the accumulator for the multiple-tau computation.
Returns: cross_correlation – the lag time (column 1) and the cross-correlation (column2).
Return type: ndarray of shape (N,2)
Notes
Changed in version 0.1.6: Compute the correlation for zero lag time and correctly normalize the correlation for a complex input sequence v.
The algorithm computes the correlation with the convention of the curve decaying to zero.
For experiments like e.g. fluorescence correlation spectroscopy, the signal can be normalized to \(M-k\) by invoking
normalize = True.For normalizing according to the behavior of
numpy.correlate(), usenormalize = False.Examples
>>> from multipletau import correlate
>>> correlate(range(42), range(1,43), m=2, dtype=np.float_)
array([[  0.00000000e+00,   2.46820000e+04],
       [  1.00000000e+00,   2.38210000e+04],
       [  2.00000000e+00,   2.29600000e+04],
       [  4.00000000e+00,   2.12325000e+04],
       [  8.00000000e+00,   1.58508000e+04]])
Cross-correlation (NumPy)
-
multipletau.correlate_numpy(a, v, deltat=1, normalize=False, dtype=None, copy=True)[source]¶ Convenience function that wraps around
numpy.correlate()and returns the correlation in the same format ascorrelate()does.Parameters: - v (a,) – input sequences
- deltat (float) – distance between bins
- normalize (bool) – normalize the result to the square of the average input signal and the factor \(M-k\). The resulting curve follows the convention of decaying to zero for large lag times.
- copy (bool) – copy input array, set to
Falseto save memory - dtype (object to be converted to a data type object) – The data type of the returned array.
Returns: cross_correlation – the lag time (column 1) and the cross-correlation (column 2).
Return type: ndarray of shape (N,2)
Notes
Changed in version 0.1.6: Removed false normalization when normalize==False.
Examples
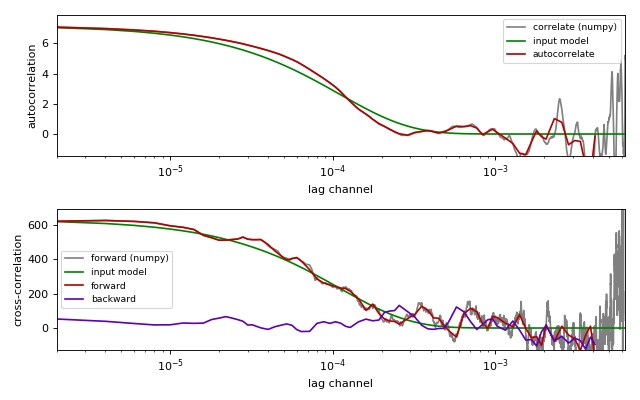
Comparison of correlation methods
This example illustrates the differences between the
multipletau correlation methods
(multipletau.autocorrelate(),
multipletau.correlate()) and numpy.correlate().
This example requires noise_generator.py to be present in the
current working directory.
compare_correlation_methods.py
1 2 3 4 5 6 7 8 9 10 11 12 13 14 15 16 17 18 19 20 21 22 23 24 25 26 27 28 29 30 31 32 33 34 35 36 37 38 39 40 41 42 43 44 45 46 47 48 49 50 51 52 53 54 55 56 57 58 59 60 61 62 63 64 65 66 67 68 69 70 71 72 73 74 75 76 77 78 79 80 81 82 83 84 85 86 87 88 89 90 | from matplotlib import pylab as plt
import numpy as np
from multipletau import autocorrelate, correlate, correlate_numpy
from noise_generator import noise_exponential, noise_cross_exponential
# starting parameters
N = np.int(np.pi * 1e3)
countrate = 250. * 1e-3 # in Hz
taudiff = 55. # in us
deltat = 2e-6 # time discretization [s]
normalize = True
# time factor
taudiff *= deltat
# create noise for autocorrelation
data = noise_exponential(N, taudiff, deltat=deltat)
data -= np.average(data)
if normalize:
data += countrate
# perform autocorrelation (multipletau)
gac_mt = autocorrelate(data, deltat=deltat, normalize=normalize)
# numpy.correlate for comparison
gac_np = correlate_numpy(data, data, deltat=deltat,
normalize=normalize)
# calculate model curve for autocorrelation
x = gac_np[:, 0]
amp = np.correlate(data - np.average(data), data - np.average(data),
mode="valid")
if normalize:
amp /= len(data) * countrate**2
y = amp * np.exp(-x / taudiff)
# create noise for cross-correlation
a, v = noise_cross_exponential(N, taudiff, deltat=deltat)
a -= np.average(a)
v -= np.average(v)
if normalize:
a += countrate
v += countrate
gcc_forw_mt = correlate(a, v, deltat=deltat, normalize=normalize) # forward
gcc_back_mt = correlate(v, a, deltat=deltat, normalize=normalize) # backward
# numpy.correlate for comparison
gcc_forw_np = correlate_numpy(a, v, deltat=deltat, normalize=normalize)
# calculate the model curve for cross-correlation
xcc = gac_np[:, 0]
ampcc = np.correlate(a - np.average(a), v - np.average(v), mode="valid")
if normalize:
ampcc /= len(a) * countrate**2
ycc = ampcc * np.exp(-xcc / taudiff)
# plotting
fig = plt.figure(figsize=(8, 5))
fig.canvas.set_window_title('comparing multipletau')
# autocorrelation
ax1 = fig.add_subplot(211)
ax1.plot(gac_np[:, 0], gac_np[:, 1], "-",
color="gray", label="correlate (numpy)")
ax1.plot(x, y, "g-", label="input model")
ax1.plot(gac_mt[:, 0], gac_mt[:, 1], "-",
color="#B60000", label="autocorrelate")
ax1.legend(loc=0, fontsize='small')
ax1.set_xlabel("lag channel")
ax1.set_ylabel("autocorrelation")
ax1.set_xscale('log')
ax1.set_xlim(x.min(), x.max())
ax1.set_ylim(-y.max()*.2, y.max()*1.1)
# cross-correlation
ax2 = fig.add_subplot(212)
ax2.plot(gcc_forw_np[:, 0], gcc_forw_np[:, 1], "-",
color="gray", label="forward (numpy)")
ax2.plot(xcc, ycc, "g-", label="input model")
ax2.plot(gcc_forw_mt[:, 0], gcc_forw_mt[:, 1], "-",
color="#B60000", label="forward")
ax2.plot(gcc_back_mt[:, 0], gcc_back_mt[:, 1], "-",
color="#5D00B6", label="backward")
ax2.set_xlabel("lag channel")
ax2.set_ylabel("cross-correlation")
ax2.legend(loc=0, fontsize='small')
ax2.set_xscale('log')
ax2.set_xlim(x.min(), x.max())
ax2.set_ylim(-ycc.max()*.2, ycc.max()*1.1)
plt.tight_layout()
plt.show()
|