multipletau documentation
General
Multipletau provides a multiple-τ algorithm Python 3.x with
numpy as its sole dependency.
Multiple-τ correlation is computed on a logarithmic scale (less
data points are computed) and is thus much faster than conventional
correlation on a linear scale such as numpy.correlate().
Recommended literature
Klaus Schaetzel and Rainer Peters; Noise on multiple-tau photon correlation data. Proc. SPIE 1430, Photon Correlation Spectroscopy: Multicomponent Systems, 109 (June 1, 1991); http://doi.org/10.1117/12.44160
Thorsten Wohland, Rudolf Rigler, and Horst Vogel; The Standard Deviation in Fluorescence Correlation Spectroscopy. Biophysical Journal, 80 (June 1, 2001); http://dx.doi.org/10.1016/S0006-3495(01)76264-9
Obtaining multipletau
If you have Python and numpy installed, simply run:
pip install multipletau
The source code of multipletau is available at https://github.com/FCS-analysis/multipletau.
Citing multipletau
The multipletau package should be cited like this (replace “x.x.x” with the actual version of multipletau used and “DD Month YYYY” with a matching date).
You can find out what version you are using by typing (in a Python console):
>>> import multipletau
>>> multipletau.__version__
'0.3.0'
Usage
The package is straightforward to use. Here is a quick example:
>>> import numpy as np
>>> import multipletau
>>> a = np.linspace(2,5,42)
>>> v = np.linspace(1,6,42)
>>> multipletau.correlate(a, v, m=2)
array([[   0.        ,  569.56097561],
       [   1.        ,  549.87804878],
       [   2.        ,  530.37477692],
       [   4.        ,  491.85812017],
       [   8.        ,  386.39500297]])
Methods
Summary:
|
Autocorrelation of a 1-dimensional sequence on a log2-scale. |
|
Cross-correlation of two 1-dimensional sequences on a log2-scale. |
|
Convenience function that wraps around |
Autocorrelation
- multipletau.autocorrelate(a, m=16, deltat=1, normalize=False, copy=True, dtype=None, compress='average', ret_sum=False)[source]
Autocorrelation of a 1-dimensional sequence on a log2-scale.
This computes the correlation similar to
numpy.correlate()for positive \(k\) on a base 2 logarithmic scale.numpy.correlate(a, a, mode="full")[len(a)-1:]()\(z_k = \Sigma_n a_n a_{n+k}\)
- Parameters:
a (array-like) – input sequence
m (even integer) – defines the number of points on one level, must be an even integer
deltat (float) – distance between bins
normalize (bool) – normalize the result to the square of the average input signal and the factor \(M-k\).
copy (bool) – copy input array, set to
Falseto save memorydtype (object to be converted to a data type object) – The data type of the returned array and of the accumulator for the multiple-tau computation.
compress (str) –
strategy for propagating values to the next register
”average” (default): average two measurements when pushing to the next level of the correlator.
”first”: use only the first value when pushing to the next level of the correlator.
”second”: use only the second value when pushing to the next level of the correlator.
Using only the first or the second values during propagation completely removes the systematic error at the cost of increasing the statistical error. See https://doi.org/10.1063/1.3491098 for a discussion on the effect of averaging.
ret_sum (bool) – return the exact sum \(z_k = \Sigma_n a_n a_{n+k}\). In addition \(M-k\) is returned as an array of length N.
- Returns:
autocorrelation (ndarray of shape (N,2)) – the lag time (1st column) and the autocorrelation (2nd column).
count (ndarray of length N) – only returned if ret_sum is True; the value of \(M-k\) for each row in autocorrelation.
Notes
Changed in version 0.1.6: Compute the correlation for zero lag time.
The algorithm computes the correlation with the convention of the curve decaying to zero.
For experiments like e.g. fluorescence correlation spectroscopy, the signal can be normalized to \(M-k\) by invoking
normalize=True.For normalizing according to the behavior of
numpy.correlate(), usenormalize=False.For complex arrays, this method falls back to the method
correlate().Examples
>>> from multipletau import autocorrelate
>>> autocorrelate(range(42), m=2, dtype=np.float64)
array([[  0.00000000e+00,   2.38210000e+04],
       [  1.00000000e+00,   2.29600000e+04],
       [  2.00000000e+00,   2.21000000e+04],
       [  4.00000000e+00,   2.03775000e+04],
       [  8.00000000e+00,   1.50612000e+04]])
Cross-correlation
- multipletau.correlate(a, v, m=16, deltat=1, normalize=False, copy=True, dtype=None, compress='average', ret_sum=False)[source]
Cross-correlation of two 1-dimensional sequences on a log2-scale.
This computes the cross-correlation similar to
numpy.correlate()for positive \(k\) on a base 2 logarithmic scale.numpy.correlate(a, v, mode="full")[len(a)-1:]()\(z_k = \Sigma_n a_n v_{n+k}\)
Note that only the correlation in the positive direction is computed. To obtain the correlation for negative lag times swap the input variables
aandv.- Parameters:
a (array-like) – input sequences with equal length
v (array-like) – input sequences with equal length
m (even integer) – defines the number of points on one level, must be an even integer
deltat (float) – distance between bins
normalize (bool) – normalize the result to the square of the average input signal and the factor \(M-k\).
copy (bool) – copy input array, set to
Falseto save memorydtype (object to be converted to a data type object) – The data type of the returned array and of the accumulator for the multiple-tau computation.
compress (str) –
strategy for propagating values to the next register
”average” (default): average two measurements when pushing to the next level of the correlator.
”first”: use only the first value when pushing to the next level of the correlator.
”second”: use only the second value when pushing to the next level of the correlator.
Using only the first or the second values during propagation completely removes the systematic error at the cost of increasing the statistical error. See https://doi.org/10.1063/1.3491098 for a discussion on the effect of averaging.
ret_sum (bool) – return the exact sum \(z_k = \Sigma_n a_n v_{n+k}\). In addition \(M-k\) is returned as an array of length N.
- Returns:
cross_correlation (ndarray of shape (N,2)) – the lag time (1st column), the cross-correlation (2nd column).
count (ndarray of length N) – only returned if ret_sum is True; the value of \(M-k\) for each row in autocorrelation.
Notes
Changed in version 0.1.6: Compute the correlation for zero lag time and correctly normalize the correlation for a complex input sequence v.
The algorithm computes the correlation with the convention of the curve decaying to zero.
For experiments like e.g. fluorescence correlation spectroscopy, the signal can be normalized to \(M-k\) by invoking
normalize=True.For normalizing according to the behavior of
numpy.correlate(), usenormalize=False.Examples
>>> from multipletau import correlate
>>> correlate(range(42), range(1,43), m=2, dtype=np.float64)
array([[  0.00000000e+00,   2.46820000e+04],
       [  1.00000000e+00,   2.38210000e+04],
       [  2.00000000e+00,   2.29600000e+04],
       [  4.00000000e+00,   2.12325000e+04],
       [  8.00000000e+00,   1.58508000e+04]])
Cross-correlation (NumPy)
- multipletau.correlate_numpy(a, v, deltat=1, normalize=False, dtype=None, copy=True)[source]
Convenience function that wraps around
numpy.correlate()and returns the correlation in the same format ascorrelate()does.- Parameters:
a (array-like) – input sequences
v (array-like) – input sequences
deltat (float) – distance between bins
normalize (bool) – normalize the result to the square of the average input signal and the factor \(M-k\). The resulting curve follows the convention of decaying to zero for large lag times.
copy (bool) – copy input array, set to
Falseto save memorydtype (object to be converted to a data type object) – The data type of the returned array.
- Returns:
cross_correlation – the lag time (column 1) and the cross-correlation (column 2).
- Return type:
ndarray of shape (N,2)
Notes
Changed in version 0.1.6: Removed false normalization when normalize==False.
Constants
- multipletau.core.ZERO_CUTOFF = 1e-15
Defines the cutoff when the absolute mean trace divided by the median of the absolute value of the trace is treated as zero.
Examples
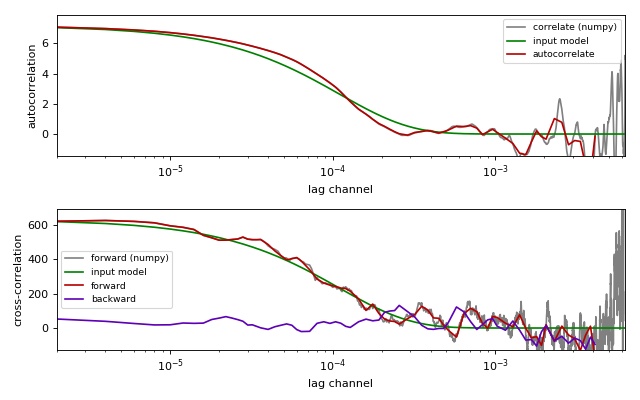
Comparison of correlation methods
This example illustrates the differences between the
multipletau correlation methods
(multipletau.autocorrelate(),
multipletau.correlate()) and numpy.correlate().
This example requires noise_generator.py to be present in the
current working directory.
compare_correlation_methods.py
 1from matplotlib import pylab as plt
 2import numpy as np
 3
 4from multipletau import autocorrelate, correlate, correlate_numpy
 5
 6from noise_generator import noise_exponential, noise_cross_exponential
 7
 8
 9# starting parameters
10N = np.int(np.pi * 1e3)
11countrate = 250. * 1e-3  # in Hz
12taudiff = 55.  # in us
13deltat = 2e-6  # time discretization [s]
14normalize = True
15
16# time factor
17taudiff *= deltat
18
19# create noise for autocorrelation
20data = noise_exponential(N, taudiff, deltat=deltat)
21data -= np.average(data)
22if normalize:
23    data += countrate
24# perform autocorrelation (multipletau)
25gac_mt = autocorrelate(data, deltat=deltat, normalize=normalize)
26# numpy.correlate for comparison
27gac_np = correlate_numpy(data, data, deltat=deltat,
28                         normalize=normalize)
29# calculate model curve for autocorrelation
30x = gac_np[:, 0]
31amp = np.correlate(data - np.average(data), data - np.average(data),
32                   mode="valid")
33if normalize:
34    amp /= len(data) * countrate**2
35y = amp * np.exp(-x / taudiff)
36
37# create noise for cross-correlation
38a, v = noise_cross_exponential(N, taudiff, deltat=deltat)
39a -= np.average(a)
40v -= np.average(v)
41if normalize:
42    a += countrate
43    v += countrate
44gcc_forw_mt = correlate(a, v, deltat=deltat, normalize=normalize)  # forward
45gcc_back_mt = correlate(v, a, deltat=deltat, normalize=normalize)  # backward
46# numpy.correlate for comparison
47gcc_forw_np = correlate_numpy(a, v, deltat=deltat, normalize=normalize)
48# calculate the model curve for cross-correlation
49xcc = gac_np[:, 0]
50ampcc = np.correlate(a - np.average(a), v - np.average(v), mode="valid")
51if normalize:
52    ampcc /= len(a) * countrate**2
53ycc = ampcc * np.exp(-xcc / taudiff)
54
55# plotting
56fig = plt.figure(figsize=(8, 5))
57fig.canvas.set_window_title('comparing multipletau')
58
59# autocorrelation
60ax1 = fig.add_subplot(211)
61ax1.plot(gac_np[:, 0], gac_np[:, 1], "-",
62         color="gray", label="correlate (numpy)")
63ax1.plot(x, y, "g-", label="input model")
64ax1.plot(gac_mt[:, 0], gac_mt[:, 1], "-",
65         color="#B60000", label="autocorrelate")
66ax1.legend(loc=0, fontsize='small')
67ax1.set_xlabel("lag channel")
68ax1.set_ylabel("autocorrelation")
69ax1.set_xscale('log')
70ax1.set_xlim(x.min(), x.max())
71ax1.set_ylim(-y.max()*.2, y.max()*1.1)
72
73# cross-correlation
74ax2 = fig.add_subplot(212)
75ax2.plot(gcc_forw_np[:, 0], gcc_forw_np[:, 1], "-",
76         color="gray", label="forward (numpy)")
77ax2.plot(xcc, ycc, "g-", label="input model")
78ax2.plot(gcc_forw_mt[:, 0], gcc_forw_mt[:, 1], "-",
79         color="#B60000", label="forward")
80ax2.plot(gcc_back_mt[:, 0], gcc_back_mt[:, 1], "-",
81         color="#5D00B6", label="backward")
82ax2.set_xlabel("lag channel")
83ax2.set_ylabel("cross-correlation")
84ax2.legend(loc=0, fontsize='small')
85ax2.set_xscale('log')
86ax2.set_xlim(x.min(), x.max())
87ax2.set_ylim(-ycc.max()*.2, ycc.max()*1.1)
88
89plt.tight_layout()
90plt.show()
Changelog
List of changes in-between nanite releases.
version 0.4.1
docs: remove Python 2 reference
version 0.4.0
ref: support NumPy 2
setup: migrate to GitHub Actions
setup: migrate to pyproject.toml
docs: remove dependency on old mock standalone library (#19)
docs: overhaul and add changelog
version 0.3.3
fix: add constant ZERO_CUTOFF that defines when a trace average is treated as zero
enh: replace asserts with raises (#15)
version 0.3.2
fix: multipletau package not available when building the docs
version 0.3.1
fix: detect correct version when building the docs from source tar ball
version 0.3.0
version 0.2.0
tests: filter warnings and check with flake8
implement unique warning classes
version 0.1.9
include docs in sdist
version 0.1.8
update documentation and example files
move documentation to readthedocs.io
version 0.1.7
code cleanup with pep8 and autopep8
always use numpy dtypes
fix tests:
take into account floating inaccuracies
support i386 numpy dtypes
version 0.1.6
also compute correlation for zero lag time (G(tau==0))
support NumPy 1.11
add tests to complete code coverage
bugfixes:
wrong normalization for cplx array v in correlate if normalize==True
wrong normalization in correlate_numpy if normalize==False
version 0.1.5
update documentation
support Python 3
version 0.1.4
integer and boolean input types are now automatically converted to floats
multipletau.correlate now works with complex data types
multipletau.correlate now checks if input data are same objects
documentation now contains examples
version 0.1.3
first non-cython implementation